Friday, April 8, 2016

Newmarket Gold - Shareholders Update

Today Luxor Capital Group, the biggest shareholder of Newmarket Gold, updated its stake in the company. Compared to the last disclosure, and after the redemption of all its convertible debentures, Luxor holds a 28.7 stake in the company. 

The chart below presents the current shareholders' structure:


As the chart shows, Eric Sprott, with a stake of 8.7%, is currently the third largest shareholder. 

Thursday, April 7, 2016

British Pound On Its Strong Long - Term Support

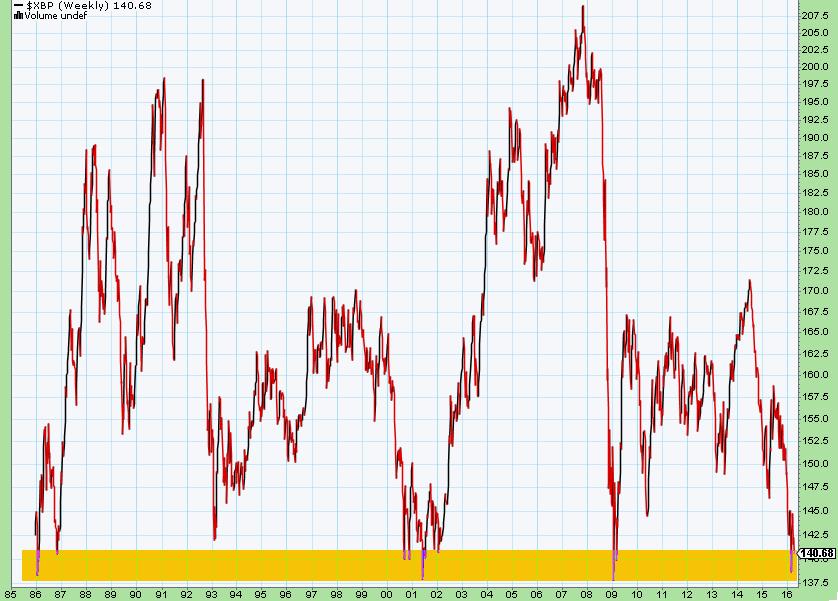
It is not a call on the British Pound but after a long way down, caused by the threat of incoming Brexit (at least some people say that) this currency seems to be at its very important long-term support level - please, look at the chart below:


                                      source: www.stockcharts.com

This thesis is supported by the net position held by the so-called commercials, i.e. traders using futures contracts for hedging:


               source: COT Report and Simple Digressions

As the chart shows, currently commercials hold a large net long position in the British Pound, which should be perceived as a bullish pattern for this currency.

Another chart - this time it shows the sentiment among another group of players, big speculators:


                   source: COT Report and Simple Digressions

As the chart shows, speculators are very pessimistic on the British Pound, which is also a bullish indication for this currency. 

Note: I am not a fan of forex - it is a very volatile market in the short-term. What is more, forex is a highly leveraged play, too risky for me. 


Wednesday, April 6, 2016

Announcement

I would like to carry out an experiment called "An Analysis On Request".

Please, feel free to send me a subject (company, sector, problem etc.) which you are interested in. In response I will prepare (for free) my analysis of this subject and publish it on this blog (no personal data will be revealed).

Please, understand that I will touch only some of the subjects (due to time limits).

Your subjects can be sent at my e-mail address: simpledigressions at gmail.com

or placed in the "Comments" section.

Tuesday, April 5, 2016

A Few Mineral Drilling Companies Increased Their Revenues In 2015

The year 2015 was a really tough time for the entire mineral sector. So it should not be any surprise that mineral drilling companies reported weak results in 2015. Simply put, due to poor metal prices the exploration budgets were cut by a majority of miners and exploration companies, resulting in lower demand for services provided by drillers. 

However, in that bad year two companies were able to increase their sales, compared to 2014. Please, look at the chart below:


                                      source: Simple Digressions

* - Energold did not report its 2015 results so all data is calculated for the first three quarters of 2015 and 2014

As the table shows, Orbit Garant and Geodrill increased their revenue by 18.7% and 34.6%, respectively. 

The first company (Orbit Garant) operates mainly in Canada and the second one develops its business in five African countries: Mali, Burkina Faso, Ghana, Ivory Coast and Zambia. Quite interestingly, both companies are among the most undervalued drilling companies. Additionally, Orbit Garant operates in the so-called safe jurisdiction (Canada) while Geodrill is active in a very prospective, but a little bit risky region of Africa. Therefore, these companies could be of some interest for investors looking for the indirect and diversified exposure to precious metals sector (another thing - both companies work mainly for precious metals companies).

Claiming that Orbit Garant and Geodrill are undervalued against their peers, I mean the below presented ratio of sales to price:


                                 source: Simple Digressions


"Sales" is defined as revenue per rig (calculated as revenue / number of rigs) while "Price" is attributable to the value of one rig (calculated as enterprise value / number of rigs).

This formula may be simplified as a multiple of sales / enterprise value. Well, the logic standing behind these calculations is to find the company offering the highest revenue  for the lowest price (defined as enterprise value). 

As the chart shows, Orbit Garant is a leader. In 2015 the company's sales were standing at C$98,250 thousand. The entire rig fleet could be acquired for C$35,545 thousand (enterprise value). Therefore the ratio sales / price was standing at 2.76 (the higher the better). Next to Orbit Garant were Capital Drilling and Geodrill. 


Monday, April 4, 2016

Eric Sprott Acquires 10 Million Shares Of Newmarket Gold

Newmarket Gold announced today that Mr. Eric Sprott acquired 10 million common shares of Newmarket Gold from the biggest company's shareholder, Luxor Capital Partners. Mr. Sprott paid C$2.25 per share. After this transaction Mr. Sprott holds 15,151,196 shares of Newmarket Gold (which accounts for an 8.67% stake in the company). 

In my opinion, high involvement of such a notable shareholder should be perceived as a big plus for the current Newmarket Gold's management. 
The management shares my opinion (or, better say, I share the management's opinion):

Douglas Forster, President and Chief Executive Officer of Newmarket stated: “Mr. Sprott is a renowned and respected leader in the investment community and one of the world’s premiere gold and silver investors. Newmarket is very pleased to have Eric as a larger shareholder of the Company and we appreciate his continued support as we continue to focus on creating shareholder value from our three producing gold mines in Australia.”

What is more, Mr. Sprott stated:

“Newmarket has a strong management team and Board of Directors. I am impressed with the progress that Newmarket has made with record gold production in 2015, the very positive outlook for production growth and operating cost reductions and its strong balance sheet with essentially no debt. I look forward to being a supportive shareholder and participating in the growth of the Company.”

What is really important - the shares were acquired at current market prices which supports my thesis that this company is strongly undervalued against its peers. 

Another thing, most recently the company's shares were trading at very high volume (an area in yellow):


source: www.stockcharts.com

It is highly probable that the supply was coming from investors who were selling shares redeemed from convertible debentures. However the question is who was buying these shares. If the buyers were investors of the similar investment attitude as Mr. Sprott, it would mean that now these shares are in strong hands...


Sunday, April 3, 2016

If Gold Goes Up In The Short-Term, The Next Bull Market Stage May Be Heralded

Many precious metal market players are waiting for significant correction in gold prices. Well, as the chart below shows, gold prices went down from their intra-day record high, printed on March 11 ($1,283 per ounce) to $1,209 per ounce on March 28.  Was it significant correction (5.8%)? I do not know but one thing makes the whole picture bullish for gold bugs. 

Namely, for the first time since the beginning of 2013, the 200-day simple moving average has been going up (green arrow). My readers know that I am not a fan of the classic technical analysis (where moving averages are applied) but the up trending long term moving average is a sign for trend followers to consider an investment. 

Another technical indication - as the chart shows, the 50-day moving average is currently above the 200-day one, which is also a bullish sign (especially for hedge funds investing in gold) but, in my opinion, it is not a reliable indicator. So, let me ignore it.


                                source: www.stockcharts.com


Another point. The chart below shows my gold sentiment index, constructed on the COT Report data:


              source: Simple Digressions and COT Reports

As the chart shows, there is huge optimism (the index reading standing at 100%, which means everybody is optimistic on gold in the short-term). This indication may by read in two ways:

  • due to huge optimism the prices of gold should go down significantly

or

  • if gold is currently in its bullish phase once again, the current high reading should be ignored (and gold should be accumulated).
The first alternative is supported by the bearish pattern - if somebody believes that gold is still in its bear market phase, short positions should be initiated now.

The second alternative is supported by the bullish patterns. As the chart shows, during a bull market phase (for example between 2009 and 2011) the indicator was showing high readings all the time. When the indicator was around 100% (over-optimism) there were only minor corrections - as a rule, the only right strategy was to hold gold. 

So, the one million dollars question is: "Is gold in its bull market phase or it is still in a bear market?" 

In my opinion, if gold starts another leg up soon, the second alternative should be regarded. 


Friday, April 1, 2016

US Stock Market Ignores The Previously Established Rules

Between 2009 and 2014 the US stock market was supported by the FED actions (the so-called "Quantitative easing") - look at the chart below:


On the other hand, every time the FED was cutting its intervention there was a significant stock market correction - look at the black arrows.

However, since March 2014 this rule does not seem to be valid anymore. Since that time the FED had not only limited its actions but even stopped it totally (the lower green ellipse). What is funny, the stock market does not care about it (the upper green ellipse). I would even say that the trend followers had beaten the FED and currently the stock market is under their control. 

One of my readers even suggested that what we see now is the result of the actions of the so-called Plunge Protection Team. Well, maybe but, please, remember that in 2000 and 2007 many people were saying that as well....