Monday, May 23, 2016

Does Investing In Mining Stocks Make Any Sense?

Investing in mining companies is a hard job. Most of the time it is a much better idea to hold gold than mining stocks. To be honest, excluding a few short periods, investing in mining companies had no sense in modern times. The chart below shows the relative strength of mining companies (represented by the XAU index) against the gold itself:


                            source: www.stockcharts.com

Indeed, only between 2000 and 2008 precious metals miners were as strong as gold. In that period the gold investors had the same investment results as the investors holding XAU (a broad portfolio of mining companies).  Then, starting from 2008, investing in a broad precious metals miners market had no sense at all (note the green, descending line). 

However, since the beginning of 2016 the situation has changed. Now mining stocks are much stronger than gold. The problem is whether this outperformance of miners is sustainable. 

Well, if history repeats, we should see a large increase in the price of gold with mining shares losing their strength against gold. If that is not the case, and mining shares continue their outperformance, we could see a gold mania. Please, keep in mind that since the start of the great bull market in gold in 2001 there was no mania at all.  

Last but not least - investing in specific miners is another thing. In my opinion, good analyst should be able to find mining stocks which are stronger than gold at various stages of the gold cycle...

Sunday, May 22, 2016

GLD Flows - Update

In my last article on GLD I noted that in May this biggest world's trading gold vault was reporting only inflows of gold. 

This week ended with another large gold inflow into GLD:


And the weekly perspepctive:


Gold And Silver - An Alternative Look At The Current Situation

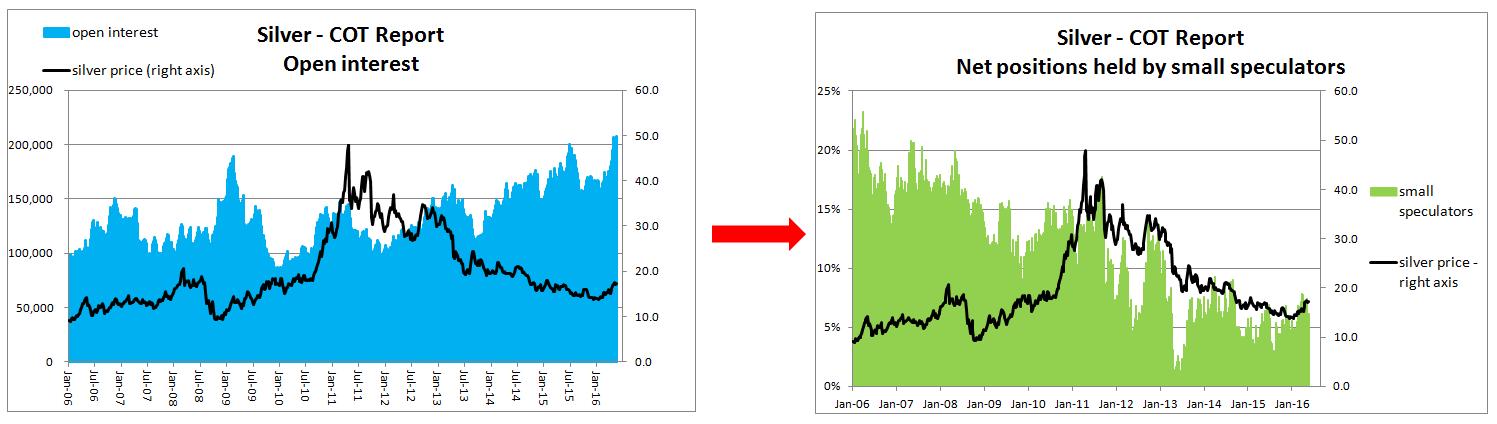
When analyzing the COT Report, most analysts focus on commercials (this category comprises mostly mining companies) and big speculators / managed money. 

However, there is another group of investors included in the COT report. This group comprises the so-called small speculators, i.e. the players that do not fall into commercials / big speculators category. 

Basically, these small players are always wrong about the market. Therefore it makes sense to take the opposite position to that held by small speculators. 

Let me show it, taking the silver and gold market as the examples:


The charts show that the current net positions, held by small speculators, are not indicative of a bullish frenzy. For example, despite the highest open interest in history, the net position (long), held by small speculators in silver futures contracts, is relatively low. This position, measured as a ratio:

               net position held by small speculators / open interest

stands at a mere 6.1%. During a bullish frenzy, these speculators used to held long positions amounting to 23%. 

The gold market looks similarly. Here the small speculators held long positions in gold futures contracts amounting to 4% (14% during a bullish frenzy). 

Summing up, these days the small speculators are not over-optimistic on gold and silver. Quite contrary, they are quite far away from that point, which is a bullish sign for precious metals (or, using different wording, it is not a bearish pattern).

Friday, May 20, 2016

Despite Lower Gold Prices, Fresh Gold Ounces Are Flowing Into GLD Vaults

As a rule, Western investors behave irrationally - when the prices of any asset go down the demand on that asset also goes down. 

During the last bear market in gold, these investors were liquidating their gold holdings at lower prices. For example, the biggest publicly traded gold fund, GLD, reported an ouflow of 719 tons of gold between December 2012 and December 2015 (a decrease of 53.2%). 

However, these days the investors behave differently. Let me look at the April - May 2016 GLD data:


               source: GLD data and Simple Digressions

The chart shows gold flows, reported by GLD, starting from April 1, 2016. 

The strange thing is that in May, despite lower gold prices, GLD reported only inflows into its vaults (there was no single gold outflow in that period). In other words, investors were taking advantage of lower gold prices to increase their long positions. 

It looks like they behave like the Chinese people - the lower the price the higher the demand.

In my opinion, it is a bullish pattern for gold. 

Thursday, May 19, 2016

Does Gold Standard Ventures Pay Too Much For Drilling?

In my first article on Gold Standard Ventures I described the Railroad Pinion Project, a flagship property. 

Today I want to touch just one issue, which is incredibly important for the company - its drilling campaigns. 

On May 18 Gold Standard announced commencing its biggest drilling program in history:


                                  source: Simple Digressions

The company plans to drill 43,000 meters at the following locations:


  • Dark Star - 20,400 meters
  • Pinion - 14,200 meters (including two new targets: Irene and Sentinel)
  • North Bullion - 4,800 meters
  • Bald Mountain - 3,600 meters
Well, it is good news. Gold Standard has to explore its properties and, what is more, it has money to do it (two majors, Goldcorp and Oceana are big, strategic shareholders).

The problem is that this campaign seems to be very expensive. In 2015 Gold Standard was paying around US$169.0 per one meter drilled. 

This year it is going to pay around US$311.6 per one meter of drilling. It is 84.4% more than last year. As far as I know, the mineral drilling industry is still in trouble. Some drilling companies show more meters drilled but the prices are lower than in 2015. 

Next thing - the biggest part of a new drilling campaign comprises RC drilling (Reverse Circulation drilling), which is cheaper than the core drilling. So this price increase has nothing to do with more expensive drilling method.

Another thing - Railroad Pinion is a shallow deposit (that is why there is so much RC drilling). It means that there will be no expensive deep drilling. 

Well, in my opinion, it looks like the company, having a lot of cash, does not care too much about it...


Wednesday, May 18, 2016

Do Not Copy Big Names (for example, Soros and Buffett)

Two days ago the financial world was electrified by the news that George Soros, a famous investor, took a large long position in Barrick Gold (ABX), worth around $264 million. 

Well, I think that George Soros is by no means a model gold bug. Simply put, this guy is able to reverse any of its positions within minutes. It means that today Soros may be holding a large short position in Barrick. This guy is totally unpredictable. So, my advice is: Forget about Soros...

Since I am writing about Soros, let me put a short note on another famous investor, Warren Buffett. Or, better said, let me show this chart:


The chart shows the relative strength of Berkshire Hathaway (an investment vehicle run by Buffett) against the broad stock market, represented by the S&P 500 index. 
First of all, in the long-term Buffett has been stronger than the broad stock market (blue trend line). However, his strength is visible only during bear market in stocks (yellow areas). 
During bull markets an investor, holding any ETF tracking the broad stock market, would report better returns than Berkshire Hathaway (green lines). 

So the recipe looks like: 
Do not buy Berkshire Hathaway shares. During bull markets in stocks be invested in any ETF tracking the broad stock market. During bear markets...hold cash.

And now relax and watch the market reaction to the FED minutes.


By the way, I recommend the last report on the U.S. economy, published by two American economists, Van Hoisington and Lacy Hunt.
According to these gentlemen, the U.S. economy is not ripe for any rate hikes. Quite contrary...

Tuesday, May 17, 2016

Richmont Mines - It Looks Like The Management Wants To Capitalize On High Share Prices

Yesterday Richmont Mines announced it wanted to issue 2.99 million shares at a price of C$10.4 a share for gross proceeds of C$31.1 million (together with the over-allotment option). In my opinion, Richmont does not need this money so the additional dilution is unfavorable for current shareholders.

Let me discuss this matter a little bit deeper.

Below you will find the company's 2016 Capital Guidance: 


                               source: Richmont presentation (slide 18)

According to that table, in 2016 the company will need C$75.9 million for its capital expenditures.

At the end of 1Q 2016 Richmont had C$61.2 million in cash and C$11.7 million in debt so it had roughly C$49.5 million in net cash. 

Now, in 1Q 2016 Richmont generated cash flow from operations of C$21.2 million (excluding working capital issues). It means that, assuming no change in gold prices, in 2016 the company should make around C$84.8 million in cash flow from operations. What is more, even at much higher 2016 gold production Richmont does not need the additional working capital  - due to its excellent financial standing the company has negative working capital (in other words, Richmont is financed by its suppliers as far as working capital is concerned).

Summarizing - after summing up the annual cash flow from operations (C$84.8 million) and net cash of C$49.5 million we find that the company's liquid assets should stand at around C$134.3 million throughout the year. It is much more than the company's projected capital expenditures of C$75.9 million.

So the question is - why did the management take this decision? Well, most recently the company's shares went strongly up. It looks like Richmont wants to capitalize on these high share prices without any reason. Just for case...