The last rally in precious metals prices and related stocks resulted in overbought condition. Nearly all charts, based on the COT reports, show bullish extremes:
Sentiment index shows over-optimism:
Big speculators, called Managed Money Managers, are holding one of the highest net long position in gold futures:
Silver shows similar patterns. For example, big speculators hold the highest net long position in silver futures in history:
Summarizing - in the short-term red warnings lights are flashing over the precious metals market.
However, in the long-term it may look different.
Let us look at the year 2005, when gold was in its initial phase of a bull market:
The green area marks the periods of over-optimism. Since the beginning of August 2005 speculators have been holding the highest net long positions in gold futures. Despite this fact, gold prices went up from $437 to $526 per ounce (an increase of 20.4%). What happened then?
The chart below shows it:
Well, gold went up from $526 to $710 per ounce in the middle of 2006 and then, after a serious correction, went through the roof.
I would say that the short-term conditions should not overshadow the big picture.
The last rally in the gold sector started on January 19, 2016 and stopped on April 29. The table below shows the returns recorded by 56 mining stocks:
As the chart shows, apart from Primero Mining, all stocks went up. The red, horizontal line shows the average return delivered by the broad big miners index ($XAU).
Coming tomorrow: the analysis of the current situation of the gold market.
In 1Q 2016 Gold Resource Corp (GORO) made no surprise. The company continued its underperformance, expressed in lower production, higher costs, negative working capital etc.
The table below summarizes the most important basic measures reported in 1Q 2016 (for comparison, I have plotted also 4Q 2015 and 1Q 2015). The yellow area marks a few relevant figures:
source: Simple Digressions
As the table shows, despite the fact that GORO was selling its gold at nearly the same prices in 1Q 2016 and 1Q 2015, cash flow from operations was substantially lower this year.
On the other hand the company is partly excused because silver prices were lower in 1Q 2016 than a year ago (the same thing was with copper and zinc prices, base metals produced by GORO).
At this point let me note that the share of precious metals (gold and silver) in the company's revenue has changed throughout the years:
source: Simple Digressions
In 2014 as much as 65.1% of sales was attributable to gold and silver. In 1Q 2016 it was only 61.2%. I think that this trend is going to stay here. It looks that with the ongoing depletion of the Arista mine the company should be delivering more base metals.
Deterioration in the quality of the Arista deposit is expressed by lower grades and recovery ratios. Here the downward trend is particularly well visible.
As the company stated in its previous releases, in 1Q 2016 production was substantially lower than in the previous quarters. The chart below presents gold equivalent production, starting from 2011:
source: Simple Digressions
Last but not least. At the end of the last quarter GORO had negative working capital, defined as inventory plus receivable less payables:
source: Simple Digressions
It does not necessarily mean that the company has financial problems. Not yet. The negative working capital is supported by cash reserves of $13.7 million so I cannot say that there are liquidity problems at the moment. However, cash has been also going down since the end of 2014 (that is why GORO had to cut its generous dividend).
Summary.
I am definitely not recommending these shares as a buying opportunity. The company's performance is deteriorating and although during the last rally in the entire precious metals sector GORO shares went up significantly (more than, for example, GDX) the company's weak fundamentals have not changed (in my opinion).
I think that the GORO investors should closely monitor the ongoing drilling campaign at the Gold Mesa property in Nevada. This company urgently needs new deposit / deposits so...maybe Gold Mesa?
In my first post on Endeavour Silver I was trying to project a few 1Q 2016 financial metrics. Let me cite an excerpt from this post:
"If my assumptions are correct, in 1Q 2016 the company should incur operating loss of $4,100 thousand (in 4Q 2015 the company lost $4,143 thousand).
Note that despite lower production, 1Q 2016 financial results should be similar to 4Q 2015 results - it is a result of higher gold and silver prices in 1Q 2016"
Well, I was wrong because the company's results surpassed my expectations - in 1Q 2016 Endeavour delivered an operating profit of $3,051 thousand. Where was I wrong?
There are two factors standing behind my error:
A. silver and gold price
I assumed that the company was selling its metals at the average prices, quoted at global exchanges: $1,184 per ounce of gold and $14.9 per ounce of silver.
However, Endeavour Silver got better prices: $1,219 per ounce of gold and $15.18 per ounce of silver. Well, I could not know these figures; to know them I would have to be an insider (I am not).
B. production cost, defined as: direct production costs + royalties + share-based compensation + depreciation and amortization + exploration + administrative expenses
I took a conservative assumption that these costs should stand at the 4Q 2015 level ($16.4 per ounce of silver equivalent).
Fortunately, the company was able to cut these costs to just $14.1 per ounce of silver equivalent (which is a very good thing).
Summarizing, if I knew these three figures (gold and silver prices and production costs) I would say that, according to my model, the company could make $2,276 thousand in operating profit (more or less in line with the actual result).
Well, as for the realized metals prices there is no way to know them (as I noted above - unless you are insider). As for costs - I promise to try harder to construct a more reliable model to assess these costs.
Unfortunately, the 2016 outlook remains unchanged - production should be lower than in 2015.
It is not the news of the day but I think it is worth mentioning in a single post.
In 1Q 2016 IAMGold, a mid-tier miner, sold all of its gold bullion it had been holding since 2002.
IAMGold was an exceptional gold miner - apart from producing gold, it was holding part of its cash reserves in the form of gold bullion. The first acquisition of gold took place in 2002. Let me cite the company (an excerpt from 2002 Annual Report):
"During 2002, the Company converted the majority of its corporate cash balances to gold bullion. As a result, the Company is exposed to changes in gold prices"
Then the company was increasing its gold bullion holdings. The only sale of gold was reported in 2009 - IAMGold sold 73.7 thousand ounces at the average price of $1,088 per ounce.
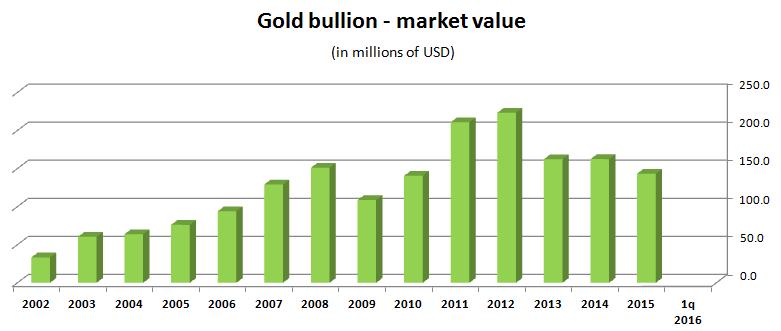
The chart below shows the history of the company's gold bullion holdings:
As I mentioned above, in 1Q 2016 all of IAMGold's bullion was sold at the average price of $1,260 per ounce. Because the book value of gold bullion was standing at $720.7 per ounce, IAMGold made a profit of $539.3 on each ounce of gold sold ($72.9 million, in total).
The company commented:
"During this period of continued volatility and uncertainty in the price of gold, having strong liquidity remains a priority for IAMGOLD and its investors", said IAMGOLD President and CEO Steve Letwin. "Selling the bullion at an average price of $1,260 per ounce crystallizes the benefit of the recent rise in the value of gold, without limiting our fundamental upside leverage to our profitability and cash flow at higher gold prices"
Well, in my opinion, it seems that the company's management behaves as a small gold investor, panicking at the bottoms. The sale of part of gold bullion in 2009, when gold was entering a new phase of a bull market, is a classical example.
In 1Q 2016 the management did the same thing. However, this time it sold all gold bullion. I think that the company need not have done that. Apart from gold bullion, at the end of 1Q 2016 it was holding cash of $586.7 million and debt of $628.5 million. It means that IAMGold is far away from liquidity problems.
If history repeats, we should see a new phase of a gold rush.
Foraco is world's third largest mineral drilling company. Today it released its 1Q 2016 report. Similarly to Caterpillar and Sandvik, these results were very weak.
On the other hand, in the case of Foraco, the first quarter of each year is always the weakest one. What is more, this time 1Q was additionally weaker than usually. Let me cite the company:
"Our Q1 was quite weak as our customers took in average one month more than last year to launch their tenders and associated drilling campaigns: this has delayed considerably the 2016 ramp up. This recent trend to compress most of the drilling budget into the last 3 quarters of the year was detected a couple of years ago, and has been amplified this year by the further decrease of metal prices seen in the last quarter of 2015"
The table below summarizes basic measures:
source: Simple Digressions
In this article I do not want to present an in-depth analysis of Foraco. Quite contrary, I want to discuss a few metrics that are important to show the current performance of the entire precious metals sector.
And, after a quick look at Foraco, one may say that this performance is still far from what gold bugs are expecting.
Firstly, the average revenue per operating rig (ARPOR) is still very depressed. In 1Q 2016 each rig delivered the average revenue of $79.9 thousand (a decrease of 27.5%, compared to 1Q 2015). As a result, in 1Q 2016 ARPOR was standing at its lowest level since 2009 (revenue delivered in 1Q 2016, for presentation reasons, was recalculated into a full year):
source: Simple Digressions
Another indication of an industry slump is the so-called "Utilization rate". According to Investopedia, "Utilization rate" is:
"A ratio used in the oil services industry that measures the amount of rigs being used as a total percentage of a company's entire fleet"
In the case of Foraco, in 1Q 2016 this rate was also standing at a very depressed level of 25% (28% in 1Q 2015).
Summarizing - 1Q 2016 results, delivered by Foraco, in no way were an indication of the end of the industry slump.
Note: Foraco is a global driller but, due to the industry slump, in 2015 the company shifted its operations mainly to developed economies:
source: Simple Digressions
As the chart shows, in 2011, during a bull market in precious metals, only 26% of revenue was attributable to developed economies (North America and Europe). In 2015 as much as 40% of revenue was earned in developed economies.
Well, I think that the company had to do it. Of the current fleet of 302 rigs, as much as 212 rigs (70% of total fleet) are diamond drilling rigs. Diamond drilling is the most expensive type of drilling so only major mineral companies can afford it. And in 2015 majors were cutting their spending heavily, mainly in riskier regions; hence Foraco's higher involvement in developed economies.
I think that when the industry recovers, the company will shift its operations to undeveloped economies once again. However, it will take some time.
Therefore, I believe that smaller and more dynamic drilling companies, operating in the regions of high mineral mining activity as, for example, Africa (especially West Africa) offer much better investment opportunities.
Newmarket Gold delivered quite decent results in 1Q 2016 (although, due to lower gold prices and higher production costs at two of its mines, Stawell and Cosmo, these results were worse than those reported in 1Q 2015).
As usually, the Fosterville mine was a leader with gold production of 33,138 ounces (57.1% of total production). The excellency of Fosterville is demonstrated by the chart below:
source: Simple Digressions
Note that direct costs have been generally stable since 2013 (between $90 - $100 per ton of ore processed) but the value of gold, contained in one ton of ore (gold content), has been in a steady increase. As a result, Fosterville delivered gross margin of $135.7 per ton of ore in 1Q 2016, 93.6% up, compared to 2013.
It means that this much higher 1Q 2016 gross margin was generated despite the fact that in the last quarter the company was selling its gold at much lower prices ($1,139 per ounce) than in 2013 ($1,407 per ounce).
Simply put, apart from lower costs of production, the Fosterville mineral deposit is currently of much better quality (for example - higher grade) than in 2013.
Laggard
As I was writing in my previous articles on Newmarket, the Stawell mine is a laggard. The chart showing its economics looks totally different from Fosterville's one:
source: Simple Digressions
Here the trend is unfavorable: costs are rising and gold content (value of gold contained in one ton of ore) is going down. As a result, in 1Q 2016 Stawell delivered negative gross margin (direct costs higher than metal value).
What is more, this mine has been delivering lower and lower amounts of gold since 2013 (for presentation reasons I have plotted the average gold production per quarter):
source: Simple Digressions
Well, despite the fact that Stawell holds 166 thousand ounces of gold, classified as mineral reserves, it looks like this mine is a closed chapter. The last two quarters support this thesis - Stawell reported losses from mining operations: $146 thousand in 1Q 2016 and $400 thousand in 4Q 2015 so mining operations at this site were unprofitable.
However, the company is confident that things at Stawell should improve in the coming future. This assumptions is based on the last discovery of the Aurora B deposit:
source: the company's presentation (slide 19)
Let me cite the company (slide 29):
The Aurora targets are located on the East Flank of the Magdala Basalt, with the shallower Aurora B approximately 400-500 m below surface. The Magdala Basalt has approximate dimensions of 3km x 1km in plan view and previous mining at Stawell has almost exclusively been from mineralization on the West Basalt Flank. The West Flank at Stawell has produced over 2.3 million ounces of gold whereas the East Flank, where the Aurora B discovery is located, has no recorded production. Aurora A could extend north to sit immediately below Aurora B (~1,200mRL), representing a potentially continuous mineralised surface for potential mining activities.
Well, I would like to know the costs of production at the Aurora B deposit. As I noted above, the Stawell's problem lies rather in its production costs than in the size of a mineral deposit. Fortunately, ore grades reported at Aurora B, are much higher than those reported in the West Flank so who knows...maybe the company's management is right.
Financial and operating results
The table below summarizes the 1Q 2016 results:
Final note
In 1Q 2016 Newmarket redeemed all of its convertible debentures. As a result, now the company holds practically no debt. Additionally, at the end of 1Q 2016 it was holding $52.1 million in cash. What does it mean? Well, let me remind one of the four pillars of Newmarket strategy (slide 4):
With quite a large amount of cash, high creditworthiness and deep capital markets relationships Newmarket Gold is, in my opinion, ideally positioned to diversify into other mining activities, for example through an acquisition of another miner / junior company.