source: www.stockcharts.com
Are there any catalysts which could move the price of soybeans out of this range (up or down)? I think there are.
First of all, deflation, the biggest threat to financial markets, may definitely lower soybeans prices. On the other hand, in my opinion, there are some fundamental developments in supply-demand equilibrium which may drive soybean prices up. Let me discuss this issue.
Firstly - demand and supply.
Supply
The chart below depicts world supply of soybeans, starting from the season 2009 / 2010:
source: United States Department of Agriculture and Simple Digressions
As the chart shows, supply was growing at the rate of 3.54% per year.
Now, demand:
source: United States Department of Agriculture and Simple Digressions
This time it is clear that world consumption of soybeans was growing at a faster rate than supply (4.78% per year vs. 3.54%).
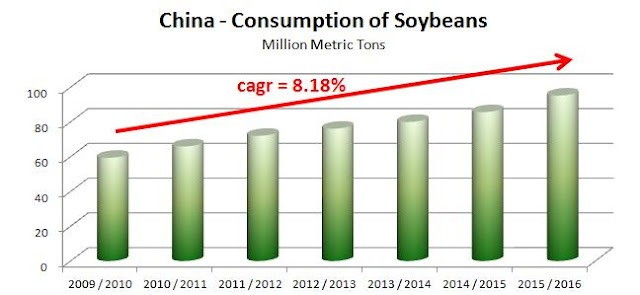
Why demand is growing faster than demand? Here is an answer:
source: United States Department of Agriculture and Simple Digressions
However, the devil is in details. In the short - term the play between demand and supply forces varies from one season to another. Please, look at the charts below:
source: United States Department of Agriculture and Simple Digressions
On the other hand, between 2009/2010 and 2011/2012 consumption was growing faster than production and prices went up from $8.5 in 2009 to $17.9 per bushel in 2012. So, in the medium-term the best indicator to look at was the difference between supply and demand.
Another indicator is presented below - this time it is "Ending Stocks measured in days of consumption":
source: United States Department of Agriculture and Simple Digressions
As both charts show, today we see consumption going up faster than supply - it should be perceived as a chance for a trend reversal in soybean prices. This development is also supported by the pattern visible on the futures market:
source: US Commodity Futures Trading Commission and Simple Digressions
The chart shows that currently the big speculators are holding large short positions in soybean futures contracts. Usually it means that we are close to the bottom in prices. Another confirmation:
urce: US Commodity Futures Trading Commission and Simple Digressions
The chart shows that smaller number of speculators wants to go short soybeans. It is also supportive for the price bottom.
Summing up - despite of incoming deflation it seems that bullish market forces are trying to gain control over soybeans. However, before taking any position, traders should closely track the current technical pattern, i.e. the trading range. If soybean prices are able to break above their resistance at around $9.2 per bushel then my thesis will start to be supported by the market action.


No comments:
Post a Comment